All of the data tables and interactive dashboards on ASIR's website have the ability to be exported to PDF format for printing.
To print a dashboard or detailed data table to PDF, look for the export icon towards the bottom of the table or visualization like the one pictured below:
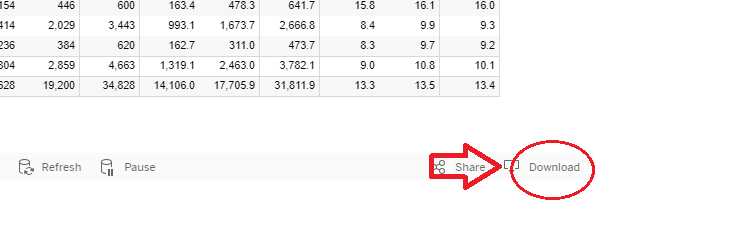
When the download icon is clicked, a dialog box displays in the middle of the data table or data view with different ways to export the data (some options may be grayed out, which indicates that it is not an available export option for the current visualization/data table). For printing purposes, select the "PDF" option.
After selecting the "PDF" option, the dialog box pictured below will appear:
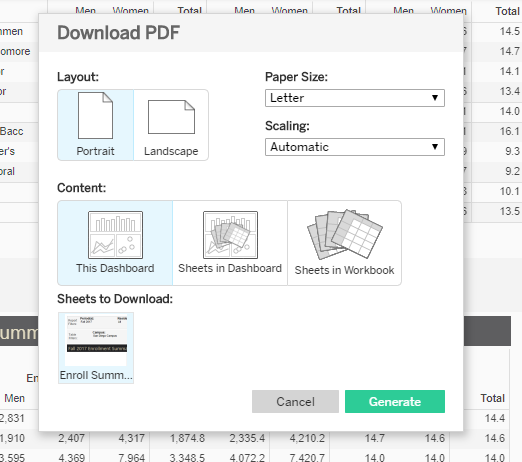
The Download PDF dialog box allows you to select the different ways that you can export the visualization/data table to PDF. You are provided with the following options/controls:
Layout: Select whether the PDF will be exported in either portrait or landscape orientations.
Content: Select whether the dashboard is exported as-is, whether each sheet on the dashboard is exported individually, or whether each individual sheet in the underlying workbook is exported (if applicable).
Sheets to Export: Select which sheets on the dashboard are exported to PDF.
Paper Size: Select the size of the pages the PDF will be exported to.
Scaling: Select how much of the dashboard will be displayed on each page of the exported PDF.
Clicking the "Generate" button pictured above will bring up a Save As dialog box that allows saving of the exported PDF file of the visualization/data table to a directory on your computer.
Please note that the way in which a data visualization/data table prints on the exported PDF may depend on the number of parameters selected. For example, printing breakpoints may differ on the PDF when printing a report that only displays Fall 2014 data versus one that displays five years worth of fall data (e.g. Fall 2009 - Fall 2014).
To print a dashboard or detailed data table to PDF, look for the export icon towards the bottom of the table or visualization like the one pictured below:
When the download icon is clicked, a dialog box displays in the middle of the data table or data view with different ways to export the data (some options may be grayed out, which indicates that it is not an available export option for the current visualization/data table). For printing purposes, select the "PDF" option.
After selecting the "PDF" option, the dialog box pictured below will appear:
The Download PDF dialog box allows you to select the different ways that you can export the visualization/data table to PDF. You are provided with the following options/controls:
Layout: Select whether the PDF will be exported in either portrait or landscape orientations.
Content: Select whether the dashboard is exported as-is, whether each sheet on the dashboard is exported individually, or whether each individual sheet in the underlying workbook is exported (if applicable).
Sheets to Export: Select which sheets on the dashboard are exported to PDF.
Paper Size: Select the size of the pages the PDF will be exported to.
Scaling: Select how much of the dashboard will be displayed on each page of the exported PDF.
Clicking the "Generate" button pictured above will bring up a Save As dialog box that allows saving of the exported PDF file of the visualization/data table to a directory on your computer.
Please note that the way in which a data visualization/data table prints on the exported PDF may depend on the number of parameters selected. For example, printing breakpoints may differ on the PDF when printing a report that only displays Fall 2014 data versus one that displays five years worth of fall data (e.g. Fall 2009 - Fall 2014).