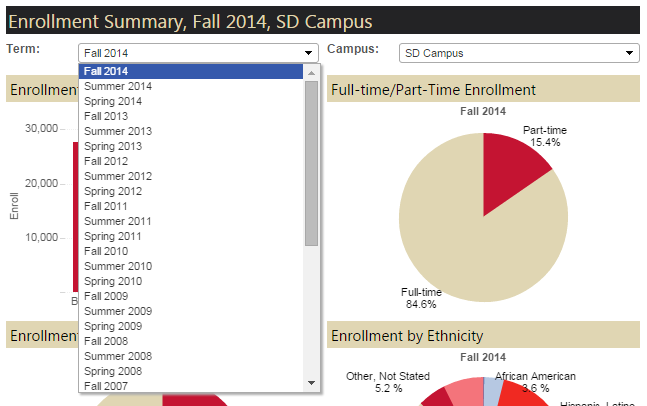
Figure 1: Single-selection filter
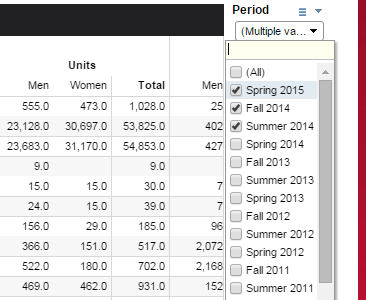
Figure 2: Multiple-selection filter
Single-selection filters (Figure 1) allow only one value to be selected for the filtering parameter. Multiple-selection filters (Figure 2) allow multiple values to be selected for the filtering parameter. For tables, this will result in additional column(s) for each additional value selected.
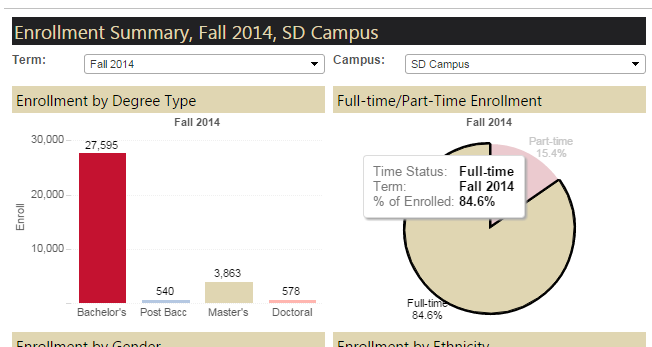
Figure 3: Additional data point information
To view related data for each data point, either hover the mouse pointer over the data point or click on it (Figure 3).
Interactive Data Visualization Navigation
ASIR's Interactive Data Visualizations allow users to explore institutional data using interactive visuals. These full-page dashboard 'storybooks' feature several pages that can be accessed by clicking on either the navigation arrows at the top of the dashboard, or by directly clicking on the section's button: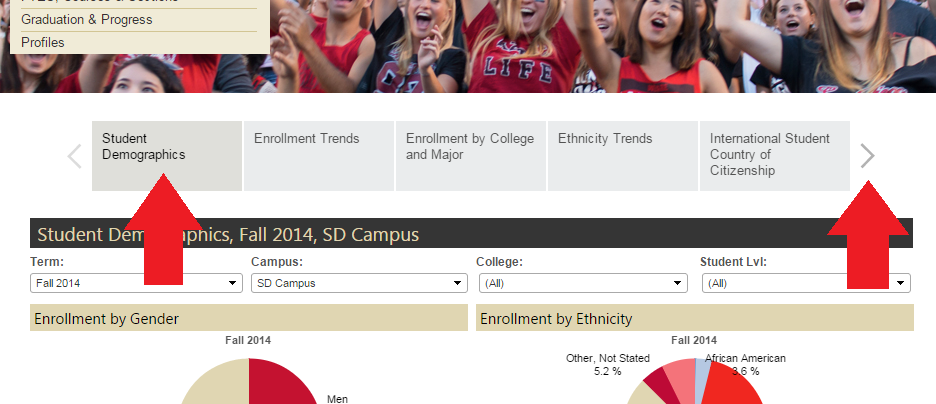
Figure 4: Interactive Data Visualization
Standard Option Controls
Each ASIR data table and interactive visualization features a standard set of option controls that can be found at the bottom of the report, as pictured below: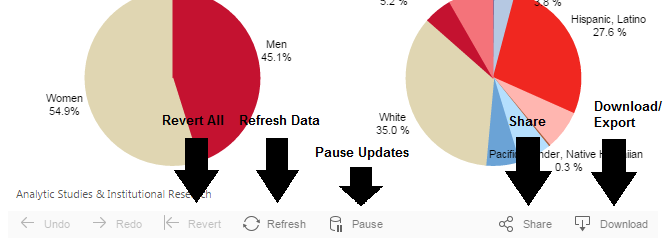
Figure 5: Tableau controls (report footer)
Download/Export: Allows the current table or view to be saved locally either as an image file, a comma-separated value file (Data), a comma-separated crosstab file (Crosstab), or a PDF. See section below for further information.
Revert All: If any changes have been made to the original state of the view/visualization (such as through changing the filter values), this will reset the view back to its original state.
Pause Updates: While interacting with the view, each change (such as changing a filter) will often trigger a new query to be sent to the data server, and thus result in a wait as the data in the view is updated. This control allows the ability to pause the data updates and to avoid waiting for each one as you make several changes at once. Clicking this button again will resume automatic data updates, and all changes made to the view before resuming automatic updates will be made using a single new query to the data server.
Refresh Data: Refreshes the current table or view by clearing any cache that may exist and retrieving the latest data from the data server.
Share: Allows the user to copy a direct link to the dashboard for sharing via e-mail. When the user receiving the link clicks on it, it will take them to a new window/tab that will display just the dashboard itself.
Export Options
As outlined above, you can export the current table or data view to be saved locally as either an image file, a comma-separated value file, a comma-separated crosstab file, or a PDF, by clicking on the Download button at the bottom of the data table/view: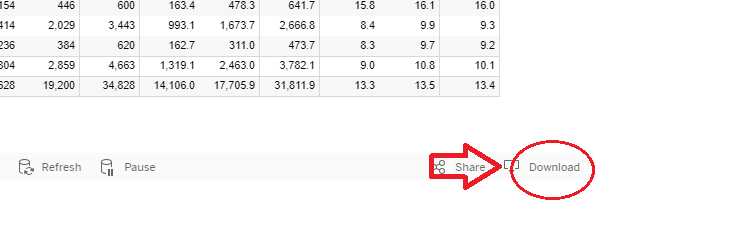
Figure 6: Location of Download Button
After clicking on the download button, a dialog box will appear in the middle of the table or data view listing your available export options:
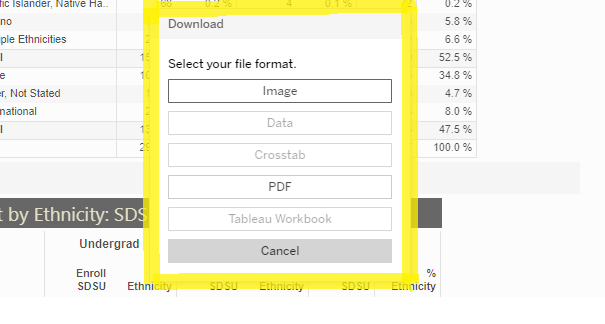
Figure 7: Export Options
Available Export Options:
Image: Save the data view as a PNG image file.
Data: Save the data in the view as a comma-separated value file. Please note that in some instances, this option may be greyed out. If the site administrator has allowed data downloads, then this option can be enabled by first interacting with the desired table/data visualization (i.e. clicking on a value in the table, clicking on the filter drop-down, or otherwise clicking in an empty area of the table).
Crosstab: Save the table or data view as a comma-separated crosstab file (.csv), which can then be opened in a spreadsheet program such as Excel. Please note that in some instances, this option may be greyed out. If the site administrator has allowed data downloads, then this option can be enabled by first interacting with the desired table/data visualization (i.e. clicking on a value in the table, clicking on the filter drop-down, or otherwise clicking in an empty area of the table).
PDF: Save the data view as a PDF (Portable Document Format). This option requires Adobe Reader or another PDF file viewer application in order to view and print the file.
Clicking one of the export options will then lead to either an options dialog box with further options for the selected export method, or a Save-As dialog box that will allow you to save the export file to your computer.
Please note, depending on the data table or view, some of the above options may not be available.